host-monitor
| ⬅ Back to Home | Overview | Architecture | Maintenance | Technology Choices | Future Improvements |
Usage
Once the Host Monitor service is running:
Access the Dashboard
Open the web dashboard in your browser:
- Production (embedded UI):
http://<server>:9090/
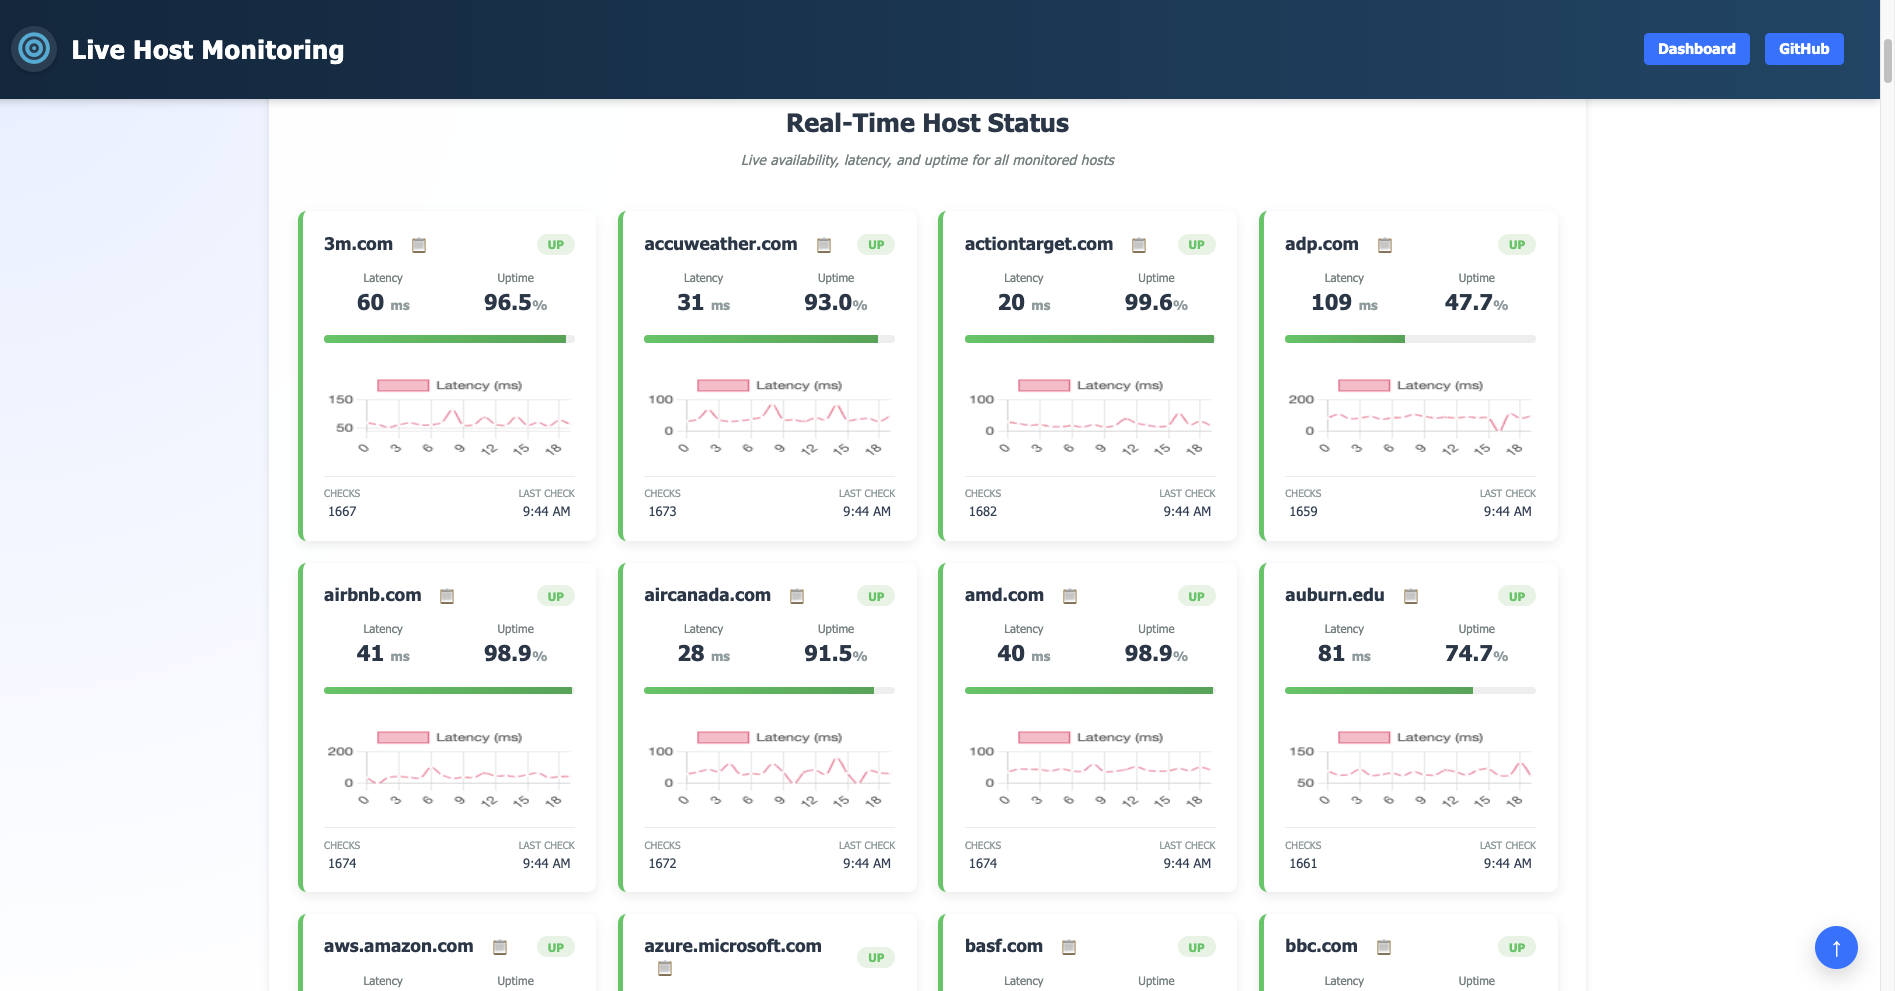
Real-Time Monitoring
View live host statuses with latency and uptime updated instantly via WebSockets — no manual refresh required.
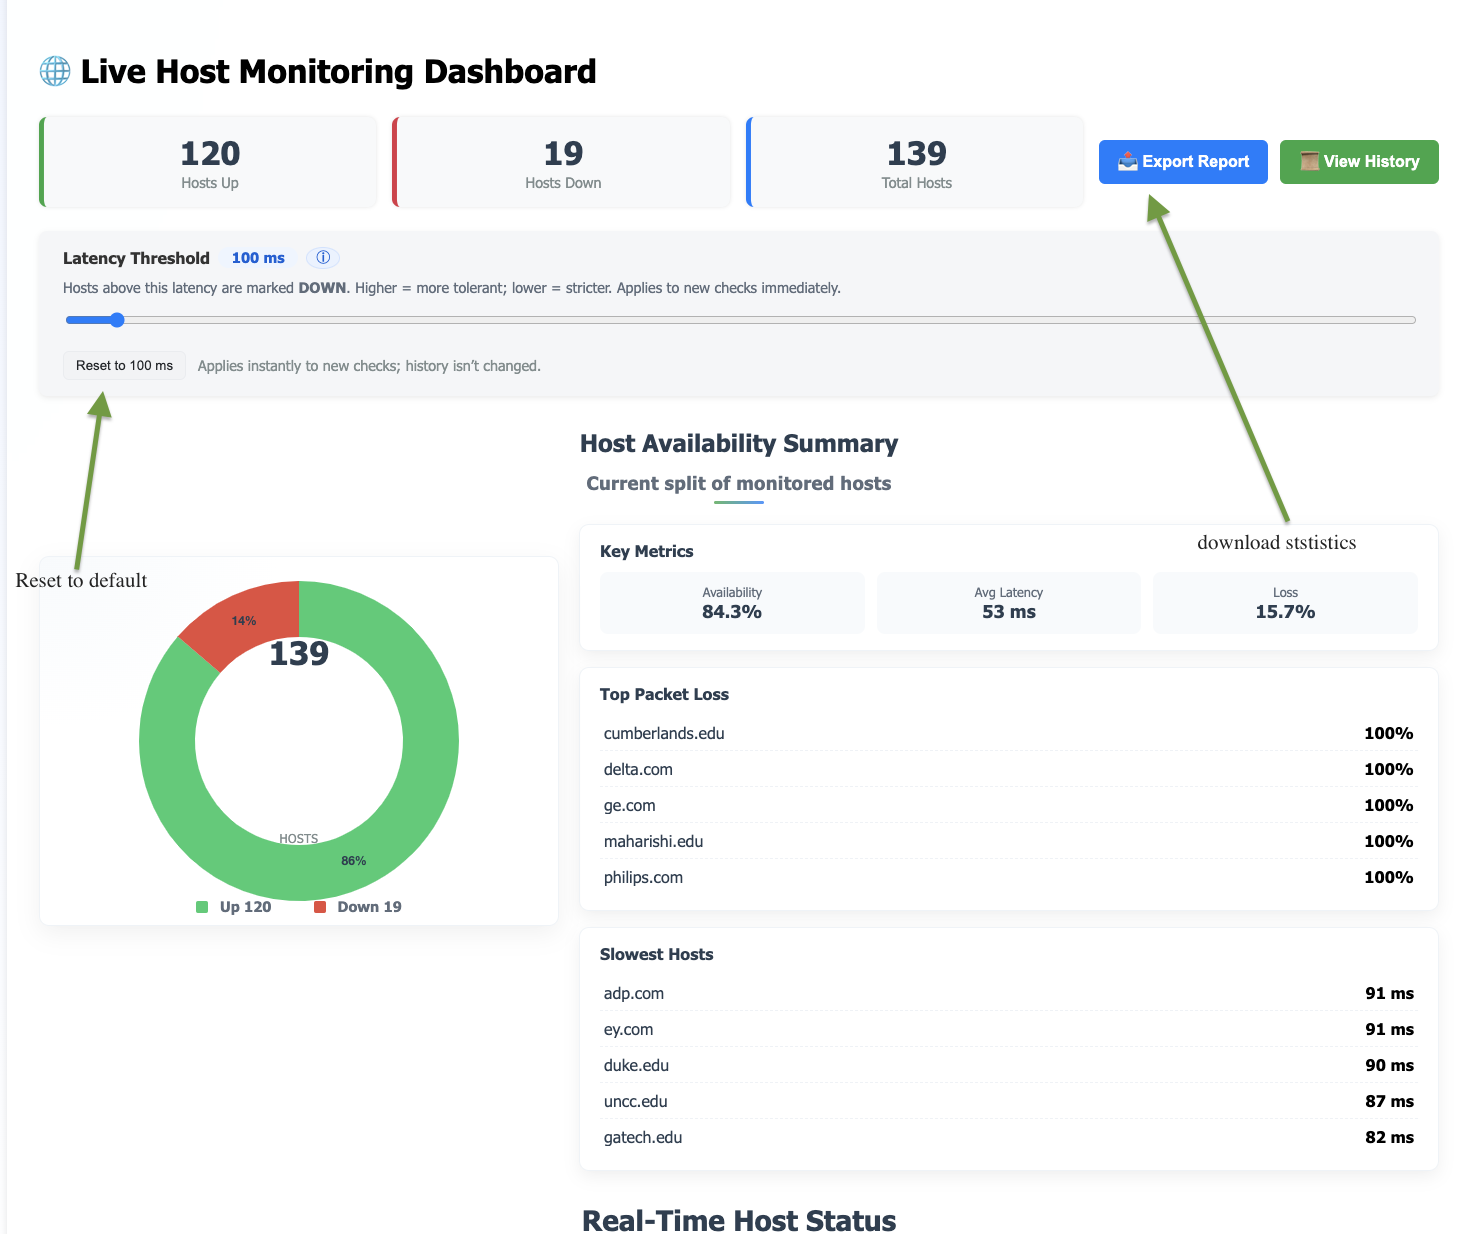
Adjust Latency Threshold
Use the Settings Panel to:
- Adjust the latency threshold
- Click Reset to 100 ms to restore the default
Changes apply instantly to new checks without restarting the backend.
Visual Insights
At a glance, review:
- KPI cards: Hosts Up, Hosts Down, Total Hosts
- Donut chart: Current split of monitored hosts
- Key Metrics: Availability, Avg Latency, Loss
- Leaderboards: Top Packet Loss and Slowest Hosts
Export Report
Click Export Report to download current statistics (uptime, latency, loss) as a CSV for reporting or analysis.
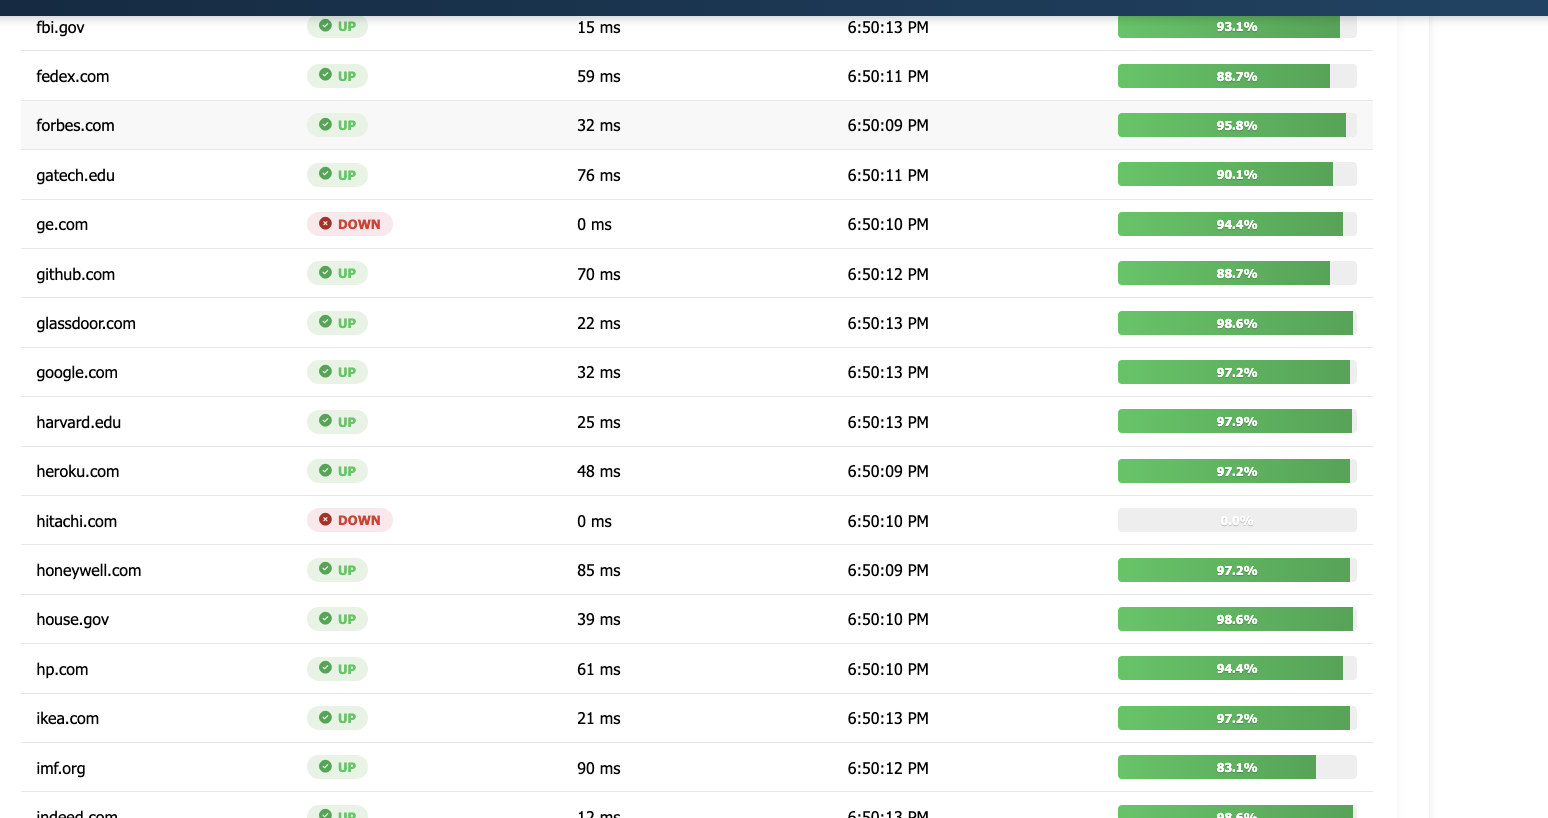
View History
Click View History to open a sortable table of recent checks with timestamps, status, latency, and loss.
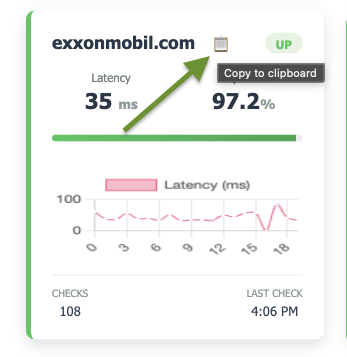
Quick Copy
Click the copy icon on any host card to instantly copy its connection details to the clipboard.
| Architecture | Setup | Maintenance | Technology Choices | Future Improvements |
© 2025 Host Monitor • GitHub Repo